

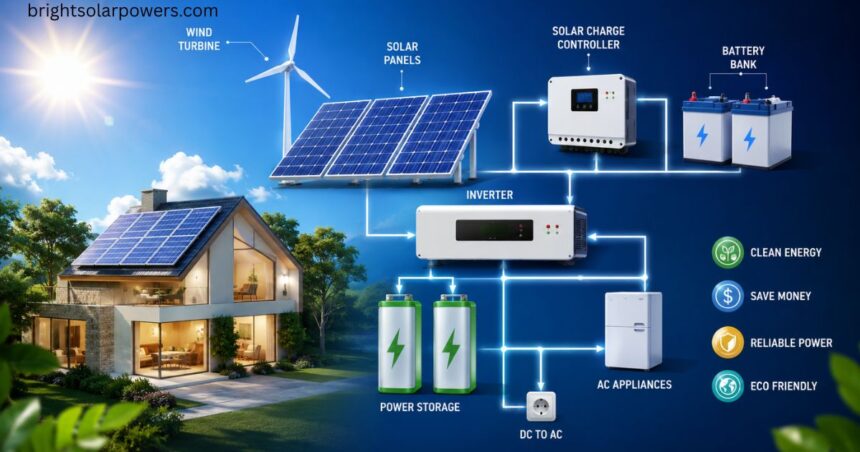
When I first sat down with a stack of solar energy diagram on a client’s kitchen table, I realized quickly that not every page means the same thing.
A solar energy diagram is really an umbrella term, and once you understand the small differences between each drawing type, the whole permit package starts to make sense.
solar energy diagram
People often use these three names as if they mean one thing, but each drawing tells a different part of the story.
A solar panel diagram usually shows the physical design of the modules on the roof, while a solar power diagram leans more toward energy flow and how electricity moves from the PV side to the home.
A solar single line diagram, or SLD, is the technical term that engineers and reviewers rely on most, since it condenses the entire electrical path into one clean cover diagram.
Meanwhile, a wiring diagram and its wiring sheets give field crews and installers the exact stringing and array layout details they need for a clean field install, and an interconnection diagram shows the utility tie-in point along with directly connected equipment.
A photovoltaic system diagram, sometimes called a solar PV system diagram, works as an overview diagram for a mixed audience of homeowners, reviewers, and installers, while the site plan, the roof layout, and supporting electrical pages round out the full plan set for a residential project or a light commercial project to meet every utility requirement.
These electrical-focused drawings stay simple to read, no matter how many pages the plan set carries.
Diagram Types in a Permit-Ready Solar Plan Set
A permit set almost never contains just one drawing. For a simple residential project, a single Wiring Diagram paired with a Site Plan and a basic Single Line Diagram, also called an SLD, may satisfy the local utility application.
But once a job grows into a C&I project or a complex project, reviewers expect a Three-Line Diagram with phase-level detail and fault-current detail, plus a Connection Diagram that shows terminations, conductor routing, and the point of interconnection.
An ESS project adds its own Storage SLD to capture battery architecture and critical loads, along with an Array Layout for equipment placement and setbacks.
A utility-facing page also lists transfer equipment, and every field-install page carries enough information for a utility-required project to move through physical layout review without delay.
Solar Single Line Diagram (SLD): The Core Solar Power Diagram for Permits
The solar single line diagram, or SLD, is the backbone of nearly every permit set, and I have never seen a residential solar single line diagram get approved without the correct electrical values attached.
This drawing needs the number of strings, solar energy diagram modules per string, and branch circuits, along with operating voltage, operating current, Voc, Vmp, Isc, and Imp figures pulled straight from the BOM.
It also documents the inverter architecture, whether that means a string inverter, a hybrid inverter, or a microinverter, and shows every one of the overcurrent protection devices, the DC disconnect, and the AC disconnect along the electrical path, all captured on one clear electrical drawing.
Reviewers check the main panel bus rating, breaker sizes, and the point of interconnection against NEC 705.11, NEC 705.12, NEC 690.13, and NEC 690.15, all tied to the 2023 cycle of the National Electrical Code and the Article 690 rules alongside NFPA standards.
The diagram also carries rapid shutdown provisions, source-circuit provisions, combiners, service equipment, metering, the production meter, an equipment schedule, ratings, and the full interconnection calculation so PV string circuits pass plan review smoothly.
When You Need a Three-Line Diagram
Not every job needs this level of detail, but once service upgrades or battery storage enter the picture, a three-line diagram becomes necessary rather than optional.
Larger commercial solar panel installations, a full industrial project, or a C&I project with multiple distribution points and backup panels will demand phase-level detail, conductor-level information, and fault-current contributions that a basic single line diagram simply cannot show.
Jurisdictions and utilities across many regions now expect a PE-stamped plan set for complex interconnections, especially where transformer data and service equipment details matter for documentation requirements.
This extra step adds to the engineering review time and the budget, but for larger systems it saves headaches later, unlike simpler residential jobs that rarely trigger these utility programs.
Solar Interconnection Diagram
Utility reviewers care about a narrower set of details than a general contractor might expect. A solar interconnection diagram must clearly show the point of common coupling, often shortened to PCC, along with the interconnection method, whether that is a load-side interconnection or a supply-side interconnection.
Utility engineers check the main breaker rating, the utility meter, the production meter, and transformer information against the interconnection application, while confirming a visible lockable disconnect and the correct AC disconnect location.
This utility-facing drawing must also prove anti-islanding compliance through UL 1741 and UL 1741-SB certification, and reference IEEE 1547-2018 for the distributed energy resource connection.
For a C&I project, additional studies may cover utility-side upgrades, accessibility, or upsized equipment, and the AHJ cross-checks everything against NEC 705.11 and NEC 705.12 before the inverter and PV system earn final sign-off.
Solar Panel Connection and Wiring Diagram: Field-Install Detail
Out in the field, the install crew relies on a different kind of drawing altogether.
The solar panel connection diagram and its companion wiring diagram spell out conductor sizes, conductor counts, conduit sizes, and conduit routing, along with fill assumptions, the disconnect wiring, and raceway paths through the junction box.
Every set of inverter wiring details matters just as much as the panel-side connections. Wire types like THWN-2, USE-2, PV Wire, and MC-4 connectors appear next to termination details, splice locations, and bonding points tied to the equipment grounding conductor, or EGC.
Crews also confirm maximum DC input, nameplate voltage, and run a cold-weather Voc check, sometimes called a cold-weather Voc calculation, based on record low temperature figures rather than the standard 25°C rating, especially for parallel strings and string inverter systems.
Once commissioning wraps up, the SLD and this electrical concept drawing both support permission to operate, or PTO, and help the inspector avoid any rejection of the modules per string count or stringing details during routing checks.
Site Plan and Array Layout
Before anyone touches a wire, the site plan and array layout set the stage for the whole physical design of the system, and this holds true for rooftop energy systems of any size.
This drawing marks the roof plane, roof pitch, tilt, azimuth, and orientation of every module layout, alongside the module make, module model, and quantity of panels planned, plus the ground array row layout for any ground-mounted job.
It also shows key setbacks, edge setbacks, and ridge setbacks required by the 2024 IFC Chapter 12 and the broader International Fire Code, plus any local amendments enforced by different AHJs.
Access pathways, PV pathways, and fire risers must stay clear of rooftop obstructions such as skylights, vents, chimneys, and other mechanicals, while the property lines and building footprint define where detached structures, battery locations, and ground-mounted equipment can sit.
The plan also covers rail layout, attachment layout, racking details, trench paths, conduit routing, the inverter location, the array location, and the point solar energy diagram of interconnection, plus pathway dimensions, all other equipment locations, and the utility meter position, all shown alongside electrical work notes and permit redlines.
Anatomy of a Solar Storage System
Every well-built solar storage system follows a diagram built from a handful of core components, and once you learn the key elements, the whole picture gets much easier to read.
Each part role works together to protect safety and keep system performance steady, and this is exactly what a residential solar storage layout is meant to show at a glance.
Solar Panels (PV Array): The Power Generators
The PV panels, sometimes called photovoltaic panels, act as the true power generators of the whole setup.
When sunlight strikes the cells, the panels produce DC electricity, and installers wire them in either series connection or parallel connection depending on the target voltage and amperage the system needs.
Each panel carries its own inverter specifications and charge controller specifications, since the wiring configuration must match the rest of the Direct Current circuit for the system to run efficiently.
The Charge Controller: Protecting Your Battery
I like to describe the charge controller as the quiet gatekeeper sitting between the solar panels and the battery bank.
Through voltage regulation and current regulation, it prevents overcharging and protects battery lifespan, using either Pulse Width Modulation, known as PWM, or Maximum Power Point Tracking, known as MPPT, to boost efficiency. Without this small but essential device, the batteries in any system would wear out far sooner than expected.
The Battery Bank: The Heart of Storage
The battery bank truly acts as the heart of any solar energy storage setup, storing power measured in kilowatt-hours and amp-hours at a set battery voltage.
Most residential systems today favor Lithium Iron Phosphate, or LiFePO4, battery cells for their long cycle life and strong capacity, paired with a Battery Management System, or BMS, that handles over-voltage protection, under-voltage solar energy diagram protection, and safety even under extreme temperatures.
This combination keeps efficiency high across thousands of charge cycles.
The Inverter: The Power Converter
The inverter handles the essential job of power conversion, turning stored DC electricity into usable AC electricity for home appliances, driving solar energy conversion from start to finish.
A hybrid inverter, which some installers still call a battery inverter, blends energy management duties with connection to the utility grid, drawing from batteries and solar panels together to keep a solar power backup system running whenever Alternating Current is needed most.
Balance of System (BOS): The Supporting Cast
The Balance of System, or BOS, rarely gets much attention, yet it holds the entire setup together.
Disconnect switches, circuit breakers, and fuses protect against safety risks, while mounting hardware and the wiring connecting every panel output keep the system running within code compliance standards year after year.
Mapping Your Energy Future: System Layouts
Choosing between diagram scenarios for solar energy storage systems really comes down to a few personal goals. Some homeowners want protection from outages, others want lower electricity bills, and some simply want a smarter system design built for backup power or even a full off-grid lifestyle.
Grid-Tied Systems with Battery Backup
A grid-tied system with battery support gives homeowners the best of both worlds. During a grid failure, the hybrid inverter switches instantly to battery power, keeping essential appliances running and supplying home power without interruption, solar energy diagram while under normal conditions the setup still allows grid export of excess energy back to the utility grid.
This kind of residential solar storage layout delivers real energy security alongside steady battery charging throughout the day.
Off-Grid Solar Systems: Complete Energy Independence
An off-grid system removes utility grid access completely, relying on the charge controller and a sizeable battery bank as the sole power source for the entire home.
Because there is no backup from the power company, careful load analysis becomes critical, and every choice made during design directly affects long-term system reliability.
AC-Coupled vs. DC-Coupled Systems
Deciding between an AC-Coupled System and a DC-Coupled System often shapes the entire integrated system. DC-coupling tends to suit new solar installations with battery-based systems, reaching efficiency figures near 98%, while AC-coupling solar energy diagram fits a retrofit onto an existing solar system that already runs a standard solar inverter, typically landing closer to 90-94% efficiency.
Each of these architectural approaches to solar energy routing and storage installations brings its own installation complexity, though AC-coupling usually offers a more streamlined design for homes upgrading with a hybrid inverter.
Blueprinting Your Own System
Anyone serious about system design should spend real time on system sizing, planning, and schematics reading before ordering a single part. Getting comfortable with these safety features early on makes every later decision far easier.
Sizing Your System Correctly
Correct system sizing starts with a full load analysis of daily energy consumption, measured in kWh, alongside the home’s peak power draw.
From there, the plan needs a target Depth of Discharge, or DoD, matched against usable storage capacity in kilowatt-hours, plus round-trip efficiency figures and a chosen number of autonomy days to keep every appliance running during a solar power backup system outage.
Safety and Protection Mechanisms
Safety devices exist to stop small problems from becoming disasters. Circuit breakers, disconnects, and fuses all work to prevent short circuits, overcurrents, fire hazards, and equipment failure, and every solar battery storage solar energy diagram diagram should show how these parts de-energize the system quickly, supporting equipment protection and ongoing maintenance.
Reading and Interpreting the Schematics
Learning to read a PV battery system schematic takes practice, but a few standard symbols make the job easier once memorized.
Look for the source of power, then trace the electricity path through the DC wiring and AC wiring, noting how different wiring styles connect panels, inverters, batteries, loads, and grounding points to complete the full power flow shown in the drawing’s information.
Evolving Designs in Solar Storage
The storage industry never stays still for long. New trends and new technologies keep reshaping overall system design, guided by shifting policies that push the entire market toward a genuinely future-proof system, a pattern I have watched unfold across the wider solar industry for years.
The Rise of Integrated Systems
More manufacturers now favor a single system diagram built around one single enclosure that houses the hybrid inverter, the LiFePO4 battery, and the charge controller together as one unit.
This approach to an ESS cuts down installation time, improves component compatibility, and has made these all-in-one units a popular choice for integrated energy storage systems.
Grid Interconnection and Policy Considerations
Broader national policies now shape how energy storage connects to a modern grid. The U.S. Department of Energy and its Solar Futures Study point toward 1,000 GW of yearly solar capacity additions on the path to 2035, all while pushing for a fully decarbonized grid through smarter grid connection rules.
Utility rules increasingly support two-way energy flow, giving both households and utilities a stake in long-term grid stability.
Future Trends: Smart Homes and AI
Looking ahead, the International Energy Agency, or IEA, expects a six-fold increase in global energy storage capacity by 2030, driven largely by renewables growth and a resilient grid.
AI-driven energy management systems now respond to real-time weather forecasts, adjusting battery charging and battery discharging automatically, while smart components track shifting electricity rates to maximize savings and support a genuinely cleaner grid for every home energy system.
Your Diagram, Your Energy Independence
In the end, a good solar energy storage system diagram becomes more than a technical requirement, it becomes an actionable plan toward real energy independence.
Every part matters, from sunlight capture through the solar panels to the high-performance batteries, including quality LiFePO4 batteries, solar energy diagram storing that clean power, and thoughtful system design turns all these components into a genuine blueprint for reliable power and a stronger energy future.
Photovoltaic Cells
A photovoltaic cell diagram shows a surprisingly simple journey. Inside every solar panel, a semi-conductor absorbs sunlight through light absorption, and this electricity conversion process turns raw energy into usable current.
From there, homeowners can watch their meter track the flow of power, whether it powers a house, a business, or shows up across a community as electronic road signs and lighting in parking lots, with many people even reaching for a solar energy diagram solar calculator.
Before their next electric company payment, since lower bills now stand in for the old electricity purchase habit, following the same basic steps used by houses connected to utility companies everywhere.
Solar Thermal Technology
A solar thermal energy system diagram works on a completely different principle than photovoltaic cells.
Rather than making electricity directly, curved mirrors and reflectors concentrate sun heat to produce thermal energy, which drives liquid heating and creates steam to spin a turbine and power a generator for electricity generation.
This same heat also supports heating water for homes, buildings, and swimming pools, while water recycling and condensation help keep large solar thermal power plants running efficiently.
Passive Solar Heating
Passive solar heating relies on smart building design rather than any mechanical parts. Positioning south-facing windows toward the Equator captures natural home warmth during winter, while overhangs, movable awnings, blinds, and shading from nearby trees manage summer cooling by blocking excess heat through each window.
Anyone planning a remodeling project can apply these same principles to bring natural sunlight and lasting comfort into a home for free.
FAQS About solar energy diagram
What is solar energy in 10 lines?
Solar energy comes from sunlight, which solar panels turn into DC electricity through light absorption and electricity conversion, then an inverter changes it into AC electricity for houses. A battery bank stores extra power for solar energy storage, giving families real energy security and a quiet sense of pride in running on clean power.
How does solar energy work, and what does its diagram show?
Solar panels absorb sunlight and send DC electricity along a clear electrical path shown in a solar energy diagram, moving through the charge controller, battery bank, and inverter to become AC electricity.
What is solar energy in Class 6?
Solar energy simply means the sunlight and heat that come from the sun, and it is completely renewable, so it never runs out. Solar panels on rooftops catch this sunlight to make electricity for homes, while solar thermal energy helps with heating water too.
What is a solar single line diagram?
A solar single line diagram, or SLD, is the key electrical drawing in a permit set, condensing the full electrical path into one cover diagram with the PV array, inverter, disconnects, and point of interconnection. It also lists electrical values like Voc and Vmp, helping reviewers approve any residential project quickly.